|
| Plant Maintenance Resource Center
Effective Monitoring of Cooling Towers
| |
|
|
|

|
Effective Monitoring of Cooling Towers
Authors : Ralph Copp and Aaron Pieroway
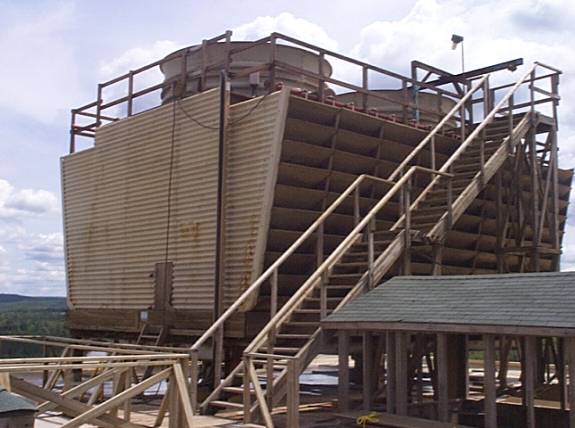 Induced draft cross-flow cooling tower IntroductionPCS Potash New Brunswick Division is a potash and salt mine near Sussex, N.B., a small farming community in the southern part of the province. Potash and salt are mined approximately 2000 feet below the surface. The salt requires little processing and is used mainly for road salt. The potash is hoisted to surface where it goes through a concentrator. There it has all the impurities removed and is sized to the needs of customers all across the world. Potash is mainly used in the fertilizer industry, being one of the three main ingredients. Cooling towers are required to remove heat from the water that has been used to cool many different systems throughout the mill. The water travels in an endless loop, from all the systems and then back to the tower where the heat is removed and back to the same systems. Basically, after the cooling water has been used to remove any excess heat from any system, it is pumped to the roof of the mill where the cooling tower is situated. The water is pumped into the top of the tower; an area called a distribution basin (hot water side). The basin has metering orifices that allow even distribution of the water over the fill. The fill acts like a radiator in a car. On top of the cooling tower, there is a large fan that draws the air through the fill, cooling the water and exhausting the hot air to atmosphere. After the water has traveled through the fill, it reaches the cold water basin at the bottom of the tower where it drains by gravity back into a holding tank in the mill. From there it is pumped to all the different systems before heading back to the tower once again. The efficiency of the tower is measured by the temperature differential between the hot water and cold water basin. Algae, dirt, scale, leaves and organic growth are some of the solids if allowed to build up that can plug the fill. The water is treated to help prevent some of this from occurring. Case HistoryCooling Towers are categorized under critical equipment in our plant. A catastrophic failure of a cooling tower has the potential to partially shut a major portion of the site down, costing thousands of dollars in lost production. It is very important that we know the mechanical condition of our cooling towers at all times.
Unfortunately, that was not always the case. Monitoring Cooling Towers at the site has changed drastically over the years. At the beginning, vibration monitoring consisted of mechanical ball/spring vibration cut-off switches mounted several feet from any actual drive equipment. This type of switch would not detect any initial mechanical fault in the drive train until a potentially disastrous failure was about to occur. Examples of these faults were motor bearing defects, bearing and gear defects in the gearbox, loose bolts, and drive shaft problems. The whole tower had to be in a spin before this type of vibration monitoring would detect a problem. Later, walk around data collection was started, but we were only able to access the motor and not the gearbox. This type of monitoring is okay for periodic checks on the motor but not acceptable for continuous monitoring of the complete power train. In the mill standard accelerometers are utilized for online monitoring on the fans. These accelerometers were mounted on the gearboxes of the cooling towers. Cooling Tower fans have certain aspects that makes them stand apart from other rotating equipment.
It is important to use a transducer on the gearbox that will effectively measure fan speed up through various gearmesh frequencies. With this requirement and recommendations from the Cooling Tower Institute, velocity pickups were installed. Unbalance should be the most common fault, which is usually measured in displacement. We only wanted to integrate once (basic rule of vibration) so that is what tipped the scale towards the velocity pickup. Since that decision was made a lot of research and development has gone into accelerometers. The accelerometers on the market today are very capable of giving reliable data on both slow and high-speed equipment. Another advantage is the size of an accelerometer compared to velocity transducers when mounting on smaller equipment.
After mounting velocity transducers (IRD 580) on the reducers and having the signal sent directly to the control room for monitoring, everyone felt more comfortable that they were getting closer to some real online monitoring. The control room was able to get a velocity and displacement overall readings from the velocity transducers. One major restriction that we do have with our present online system is the inability to generate any spectrums or band alarming from our control room. Again, all the control room receives is an overall vibration signal. This is totally inadequate for truly effective machine condition monitoring. This, in our case can be very problematic because at times the overall vibration level at the cooling towers can be relatively high. The tower is supported on a steel structure on top of the roof approximately 225 feet off the ground, making it a natural cantilever. The building sways back and forth at 198 c.p.m., (fig. “2”) and the towers being on the top of the building are exposed to the bulk of this vibration. The building vibration is continually being excited by vibrating screens throughout the mill. High resolution spectra was taken at both the tower and vibrating screens to confirm that the exciting force at the towers is coming from the vibrating screens in the mill. The spectrum in Figure “2” taken at the cooling tower indicates a dominant frequency of 197 c.p.m. By comparing this to the dominant frequency in Figure “3” of 198 c.p.m., which represents the output r.p.m. of the Vibrating Screens, confirms that the exciting force at the cooling towers is coming from the vibrating screens operating in the mill. Over the years, several false vibration alarms have come in at the control center showing severe vibration at the cooling towers, when in actual fact it was the building vibration that had increased. Figure “4” is a trend comparing mill vibration to actual fan vibration. The building continually vibrates at 197 c.p.m. which is much higher than the 1x fan vibration. Unfortunately, this causes many false alarms at the control room. This is a good example why band alarming is extremely useful in an online vibration monitoring system. A highpass filter to filter out the low end background noise would also be an asset. A filter in this application would also increase the dB range of the system so that there would be less attenuation at the high end of the FFT. In the control room, we only alarm on velocity because displacement is too sensitive to low frequency vibration.
However, there is a data collector interface at the signal conditioning rack to plug into with a data collector. This allows the collection of spectrums and waveforms while performing routine data collection or whenever there could be a problem arising. Having this ability allowed us to head off at least a couple problems before a major failure may have occurred. The first problem was spotted after noting that the 1x vibration at fan speed had increased (Fig. “5”). Although, a 1x vibration is usually the first indication of unbalance, that was not the problem. It was during the early summer when the vibration level increased. The cooling tower was shut down to allow us and the mechanics to do an inspection, which revealed major cracks in the gearbox base. The cracking was severe enough that the gearbox was flexing a fair amount, especially at high speed. Severe corrosion was the main cause of the problem. If allowed to go undetected, this could very well have lead to a significant failure. After welding up the cracks, the amplitude at 1x returned very close to normal.
A second problem that showed up at 1x the input shaft speed was also detected. Through routine data collection, it was noted that the frequency at 1x input shaft speed had increased dramatically in amplitude with multiple harmonics (Fig. 6). Again, the tower was shutdown to allow for an inspection. A suggestion was made to the mechanics to give the jackshaft a close check because it was felt there was looseness showing up in the drive train that was directly related to the input speed. This remark headed the mechanics in the right direction, as they quickly noted that the jackshaft coupling inserts were completely worn out. This was causing looseness in the drive shaft. Most of the rubber was completely missing on a couple of the inserts. After replacing the inserts and doing a laser alignment, the vibration levels returned to normal.
We also experienced vibration problems after a major overhaul of the cooling towers. PCV honeycomb fill was replaced and new style fan blades installed because they were not cooling to acceptable standards. The new blades are hollow, made from fiberglass and shaped very similar to an airplane propeller. They are more efficient than the original blades, as they move more air with fewer horsepower. After the job was completed, both tower fans had to be balanced. The tower structure has weakened over the years because of normal aging and being weighted down with sludge in the fill. The tower swings back and forth with little restriction because of less dampening in the system. Unfortunately, this causes the overall vibration level to increase. It is necessary to have the unbalance force down to a minimum. Fig. “7” is a multiple spectra display showing the results of the balance job. The unbalance force went from 11 mils to 2 mils. At an operating speed of 324 rpm, this level of vibration is considered very good.
Conclusions
Copyright 1996-2009, The Plant Maintenance Resource Center . All Rights Reserved.
|