|
| Plant Maintenance Resource Center
2000 Maintenance Salary Survey Results
| |
|
|
|

|
2000 Maintenance Salary Survey ResultsOverviewThe second annual survey of salaries in the Maintenance sector was conducted on the Plant Maintenance Resource Center website between January and March 2000. The survey has highlighted a few interesting findings, some of which differ from those found in the inaugural survey, conducted last year.This salary survey is a regular, annual event. The 1999 Salary survey results are available here. If you would like to be notified via e-mail when the 2001 Maintenance Salary survey opens, please send an e-mail to salary-survey2001@plant-maintenance.com. Raw Data - OverviewVoluntary (and confidential) responses were sought to the survey, and 320 valid responses were received from a wide range of individuals. This was approximately 10% more than the 290 responses received in 1999.Raw Data - IndustriesThe greatest number of responses were from individuals in the Manufacturing industries. There were comparably fewer responses from the Maintenance Contracting industry and from Maintenance Consultants in this years survey, compared with last year. A complete list of industries represented is tabulated below.
Raw Data - CountriesOver 75% of the responses received were from the USA, followed by Canada, Australia and the United Kingdom as the countries with the next greatest number of responses.
Raw Data - Job PositionsThe positions with the greatest representation in the survey were Maintenance Managers/Superintendents, followed by Plant/Maintenance Engineers, Maintenance Foremen/Supervisors, Maintenance Technicians, and Maintenance Trades/Craftspeople. There were a higher proportion of all of these job positions in this year's survey compared with last year.
Raw Data - Educational LevelsEducational levels represented were fairly widespread. It is interesting to note in this years survey the relatively smaller number of trades/crafts trained respondents, but the higher proportion of those with Certificates/Diplomas/Associate Degrees.
Raw Data - Work ExperienceA wide range of work experience was represented, as well, with the proportions being roughly in line with last year's survey.
Raw Data - SalariesThe total annual earnings, inclusive of all benefits, displayed a similar distribution to last year, although overall salaries appear to be slightly lower than last year.
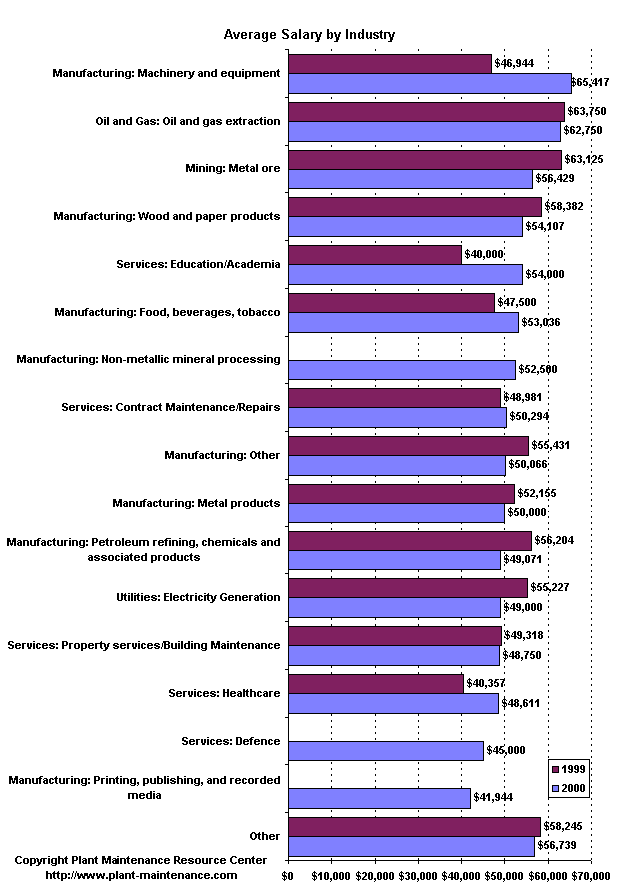
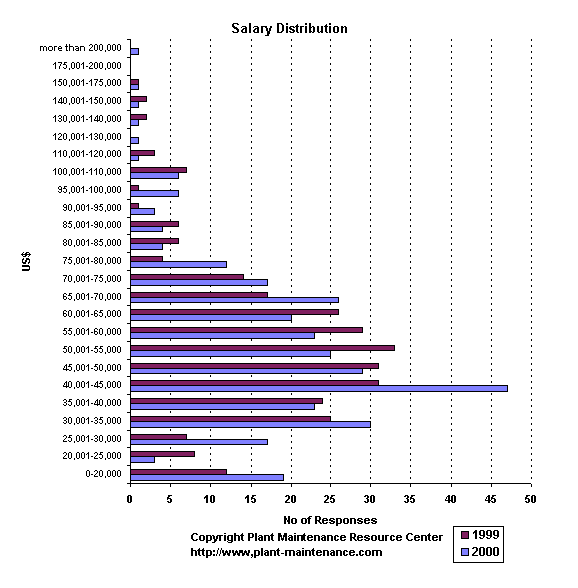 Overall ResultsThe median salary band was US$45,001-$50,000. In 1999, the median salary band was US$50,001-$55,000. Assuming the average salary for each band is the midpoint of each band, the mean salary in 2000 is US$52,523,around $1,000 or 1.9% lower than the mean salary of US$53,521 in 1999.Salary by IndustryAn analysis of salaries by industry (for those industries with 5 or more responses) indicated that the industries paying the highest salaries were Manufacturing:Machinery and Equipment (which showed a large increase in average salary thiw year compared with the previous year - probably due to statistical variation on a fairly low number of responses), Oil & Gas extraction, and Mining.Note that, for the purpose of this analysis, only industries containing 5 or more respondents were included. The overall result is shown graphically below.
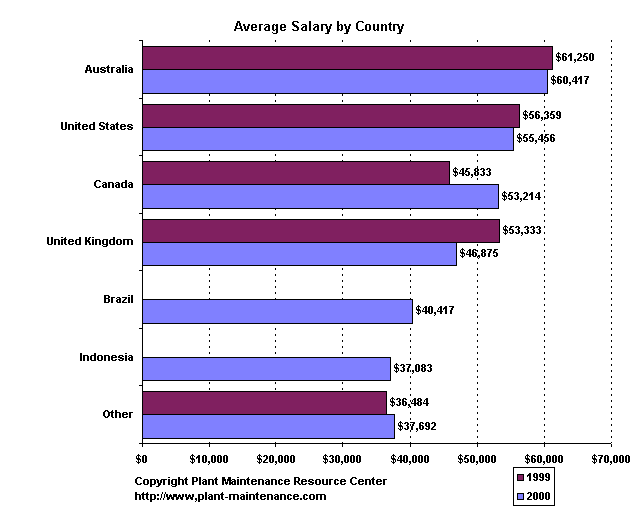
Salaries by CountryOnce again, only countries with 5 or more respondents were included in this analysis, which showed that the highest salaries were to be obtained in Australia, followed by the US and Canada (as was the case last year). The difference in salaries between Canada and the USA seems to have reduced significantly. Of course, it should be noted that tax rates will differ between countries, as will the cost of living, so direct comparisons of salaries between countries should be treated cautiously. In addition, changes in exchange rates mean that comparisons, year on year, between non-US countries should also be treated cautiously.
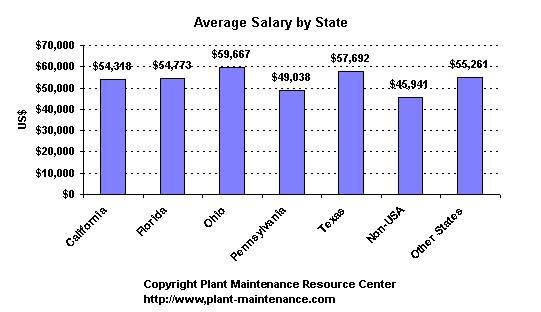
Salaries by StateOf those states with more than 5 responses, it appears that Ohio and Texas pay more than average, whereas Pennsylvania salaries are lower than average.
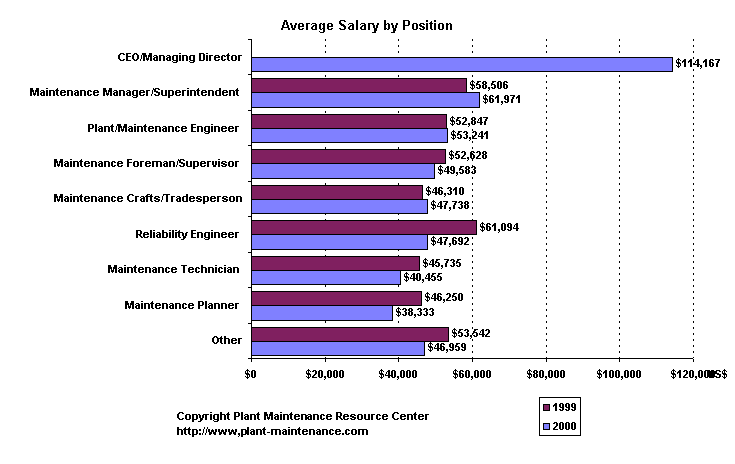
Salaries by PositionYet again, only positions with more than 5 respondents were included in this analysis. This indicated that the highest paying position was CEO/Managing Director (not unsurprisingly). Unlike last year's results, Maintenance Managers/Superintendents were the next highest paid positions, followed by Plant/Maintenance Engineers who were paid more than Maintenance Supervisors/Foremen. It is also interesting to note that, based on this years results, on average, Maintenance Planners are paid 22% less than Maintenance Foremen/Supervisors, and earn significantly less than Maintenance Crafts/Tradespeople and Maintenance Technicians - although this may also reflect the fact that Foremen/Supervisors and Crafts/Tradespeople/Technicians often are required to work shift work and/or at weekends (with an appropriate pay premium), whereas Maintenance Planners generally work regular Monday to Friday day hours.
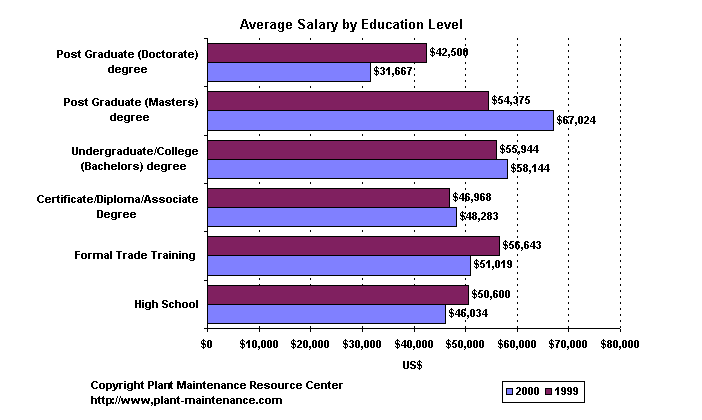
Salary by EducationA more expected result in this year's survey compared with the surprising result from last year. Based on this year's results, it would appear that increasing levels of formal educational qualifications generally lead to increasing salaries (with the exception of those who have completed a Doctorate). Having completed a Bachelors/College degree appears to result in an average 14% higher salary than those having completed formal trade/craft qualifications.
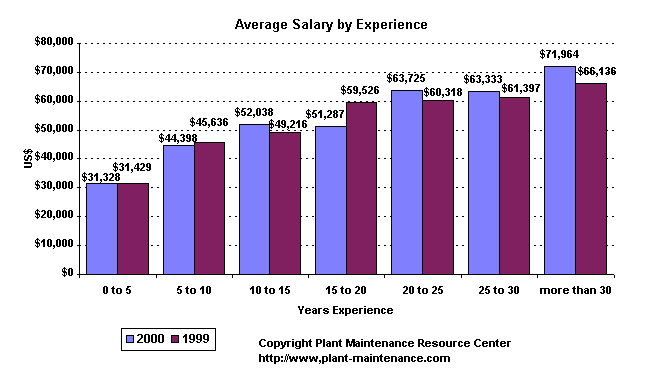
Salary by ExperienceOnce again, this survey highlights that there is no replacement for experience in generating additional salary. Increases in salary are most marked in the early years, but continue until retirement.
Future enhancementsIn the survey, opportunity was given to respondents to comment on the survey, and many valuable suggestions were made. As the survey was, for obvious reasons, confidential, we were unable to respond directly to those making the comments, but take this opportunity to respond to the comments that were made. Company sizeIt is likely that overall company size may be a determining factor for overall salary levels. This will be included in future surveys.A few other comments were made regarding the Plant Maintenance Resource Center site in general, for which we offer thanks, and will endeavour to cover the topics requested, as time permits. ConclusionIn summary, the main conclusions from this survey are:
Throughout the year, the Plant Maintenance Resource Center runs a series of surveys on topics of interest to Maintenance professionals. To access the latest survey, visit here Ó
Plant Maintenance Resource Center 2000
If you wish to copy or distribute this article, please email me to ask for permission first!
Copyright 1996-2009, The Plant Maintenance Resource Center . All Rights Reserved.
| |||||||||||||||||||||||||||||||||||||||||||||||||||||||||||||||||||||||||||||||||||||||||||||||||||||||||||||||||||||||||||||||||||||||||||||||||||||||||||||||||||||||||||||||||||||||||||||||||||||||||||||||||||||||||||||||||||||||||||||||||||||||||||||||||||||||||||||||||||||||||||||||||||||||||||||||||||||||||||||||||||||||||||||||||||||||||||||||||||||||||||||||||||||||||||||||||||||||||||||||||||||||||||||||||||||||||||||||||||||||||||||||||||||||||||||||||||||||||||||||||||||||||||||||||||||||||||||||||||||||||||||||||||||||||||||||||||||||||||||||||||||||||||||||||||||||||||||||||||||||||||||||||||||||||||||||||||||||||||||||||||||||||||||||||||||||||||||||||||||||